Manufacturing Inventory Just Exceeded 2007 Levels. Here's What That Means for AI Investors.
Inventory stockpiles exceed pre-financial crisis levels. The Fed is cutting rates. And the manufacturing data is telling a story about AI capital flows that Wall Street is ignoring.

Unsold warehouse stock is sitting at 1.37 times monthly sales.
That’s higher than 2007’s peak of 1.31. Higher than the financial crisis era. Companies pulled forward orders ahead of tariffs. Now they’re sitting on inventory they can’t move.
S&P Global used unusually blunt language for a survey shop. They called it “the steepest warehouse stock rise in 18-year history,” with manufacturers “making goods but not finding buyers.” That’s the inventory trap I’ve been tracking in the background while everyone argues about rate cuts and AI hype. The data finally caught up.
Manufacturing is contracting. New orders fell to 47.4 in November 2025, the lowest in four months. Employment indices show weakness across major economies. By ISM’s count, manufacturing has contracted 35 of the last 37 months.
Two clean signals. Same message.
This matters for AI. Not because a language model cares how full a warehouse is. It matters because the capital that funds data centers, the supply chains that deliver GPUs, and the economic backdrop that makes trillion-dollar buildouts feel “normal” all sit downstream of manufacturing health.
When manufacturing rolls over, capital gets careful. When capital gets careful, timelines slip. Quietly.
The Federal Reserve cut rates by 25 basis points on December 18, 2024, exactly as predicted. Governor Waller then signaled another cut for December 2025. The easing cycle is real. But rate cuts can’t manufacture demand that doesn’t exist. They can’t empty warehouses. They can’t make companies hire when order books are thin.
Over the last week I’ve been tracing the dependencies. The tariff-driven inventory surge. The manufacturing weakness that follows. The circular capital flows showing up inside private AI. The aggressive financial engineering at Strategy Inc (formerly MicroStrategy) that introduces a very specific kind of fragility. And then, on the other side of the page, the places where this setup creates clean opportunity. Robotics supply chains. Quality tech incumbents trading at valuations that don’t require perfection.
What I’m left with isn’t doom. It isn’t hype either. It’s a speed bump with real mechanics behind it, happening at the same time as a real buildout that still needs atoms, not narratives.
So I’m going to lay out what I think is actually happening under the headlines. And where the risks could turn into trades when the market finally has to deal with the math.
The Manufacturing Mirage
Companies saw tariffs coming. They did what rational actors do.

They pulled demand forward.
The December 2024 ISM Manufacturing Report basically spelled it out. “Seasonal factors plus increased demand outlook for 2025” drove new orders. In plain English, a lot of that “demand” was inventory behavior.
Governor Waller confirmed the same mechanism in November 2025, noting that “the fraction borne by consumers will only modestly boost inflation—an effect that has been quite gradual so far because of the slow drawdown of inventories that was built up in anticipation of tariffs.”
That phrase matters. Slow drawdown.
Because if you stockpile, you eventually stop ordering. Not because the world ended. Because you already bought the stuff.
The inventory-to-sales ratio hit 1.37 in August 2025. That’s not “a little elevated.” That’s above the 1.27 to 1.31 range that showed up in 2007 before the financial crisis. Meanwhile, between 2022 and 2023 alone, the U.S. added 1.1 billion square feet of new warehouse space. That’s not a gentle build. That’s a rush.
Now the rush is reversing.
New orders contracted to 47.4 in November 2025 from 49.4 in October. The ISM Employment Index fell to 44.0 from 46.0. S&P Global’s PMI language matched the direction, saying employment “fell for the second time in three months as job shedding in the manufacturing sector deepened.”
So you get this picture.
The tariffs arrived. The inventory is sitting. The incentive to place new orders evaporates. And a temporary boom created by stockpiling flips into a temporary hole created by digestion.
I think of it as a manufacturing speed bump. Not a cliff. Not a multi-year depression. A period where the prior quarter’s “strength” becomes the next quarter’s “weakness” because companies are working through boxes instead of ordering new boxes.
ISM research even indicates companies are already shifting back toward just-in-time inventory management. They say “it appears JIT has won the game yet again, as it did through the 2008 global financial collapse.”
Lean inventory reduces carrying costs. It also means less near-term manufacturing activity once the stockpile phase ends. It’s good business. It’s bad for the PMI print.
And it has a very specific interaction with AI infrastructure.
Data centers are physical. Transformers. Switchgear. Cooling systems. Backup generators. Steel. Copper. Concrete. The “AI buildout” is not just GPUs and optimism. It is procurement schedules and equipment lead times and crews that show up on site.
When traditional manufacturing demand is soft because warehouses are full, capacity can become available for data center construction. That sounds like a tailwind.
But there’s another side of the same mechanism. When manufacturing employment is contracting and order books are thin, the people writing big checks start asking harder questions. That’s when timelines slip. Not because someone cancelled AI. Because the environment shifts from “growth at any cost” to “show me the revenue path.”
That’s the tension. Same speed bump. Two different outcomes depending on duration.
The Great PMI Divergence
Here’s the part that actually made me stop and reread the releases. Two surveys are telling opposite stories about the same manufacturing economy.
ISM Manufacturing PMI printed 48.2 in November. That’s the ninth consecutive month of contraction. Below 50 means shrinking.
S&P Global Manufacturing PMI printed 52.2 in November. That’s the fourth consecutive month of expansion. Above 50 means growing.
A 4.0 point gap.
That gap is not a rounding error. It’s a mechanical signal.
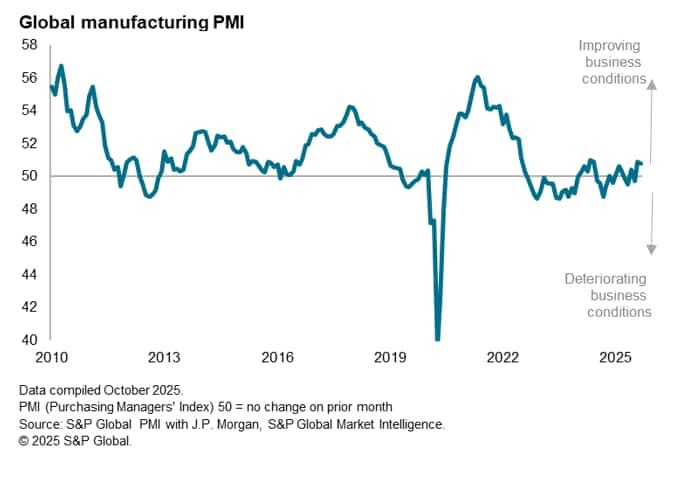
S&P Global basically gave away the answer in their own commentary: “For two months, warehouses filled with unsold stock to a degree not seen since data available in 2007.” They added the key line. “Manufacturers making more goods but not finding buyers. This unplanned accumulation is usually a precursor to reduced production.”
So what’s going on?
ISM is closer to a demand pulse. New orders. Customer sentiment. Actual buying. S&P Global is more output-centric. Production. Activity. Stuff being made.
When production runs ahead of demand, you don’t see the mismatch in one clean number. You see it in inventory. You see it in warehouses. You see it in the divergence between a demand-sensitive survey and an output-sensitive survey.
ISM at 48.2 says demand is contracting. S&P at 52.2 says output is still expanding. Put them together and you get the same thing the inventory-to-sales ratio is screaming. Goods are piling up.
That can’t run forever. Warehouses fill. Production adjusts down. The surveys converge.
The only question is how they converge.
Either demand picks up and ISM rises toward S&P’s level. Or production slows and S&P falls toward ISM’s level.
The historical pattern is the second one. Unplanned inventory accumulation is usually followed by production cuts. Not because executives are pessimists. Because they’re out of space and out of buyers.
And the timing matters for AI infrastructure in a way most people aren’t watching.
If production cuts show up in early 2026, capacity opens up. Electrical equipment suppliers. Steel fabricators. Cooling system manufacturers. The people selling into traditional industry face softer demand, and data center buyers can often get better terms and better delivery windows.
But if the inventory overhang lingers into mid-2026, the “manufacturing thing” stops being a manufacturing thing. It bleeds. Profits soften. Budgets tighten. And the big AI projects that assumed an easy funding environment run into real friction. The kind that doesn’t show up on a hype chart.
I’m watching for the convergence. That’s the trip wire.
The Fed’s Limited Toolkit
The Federal Reserve did what it telegraphed.
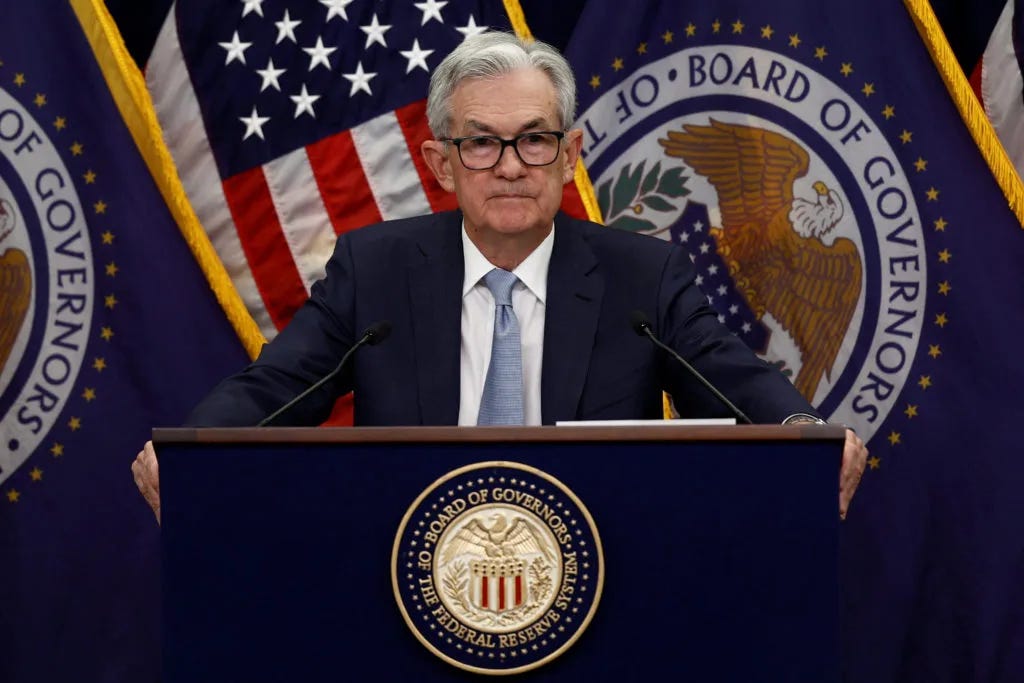
On December 18, 2024, it cut rates by 25 basis points to 4.25 to 4.5%. Powell was explicit: “we can therefore be more cautious as we consider further adjustments to our policy rate.” September 2025 brought another cut to 4.0 to 4.25%. Waller signaled support for a December 2025 cut in his November speech.
Market pricing shows about an 80% probability of another cut at the December 9-10 Fed meeting.
So yes, easing is happening.
But here’s what I can’t get past. Rate cuts don’t create demand. They change the price of money. They support asset prices. They loosen financial conditions.
They do not make someone buy a warehouse full of goods they already have.
Waller basically acknowledged the limitation. He said “the labor market is still weak and near stall speed” and that “restrictive monetary policy is weighing on the economy, especially about how it is affecting lower-and middle-income consumers.”
That’s the Fed responding to softness. Not the Fed “engineering growth.”
For AI, the connection is straightforward.
Cheaper credit helps fund data centers. But if the underlying economy weakens enough that recession risk rises, even cheap money gets picky. Lenders want revenue visibility. Operators want customer commitments. Hyperscalers want proof that enterprise budgets won’t freeze.
And enterprise budgets are a function of profits. Profits are a function of demand.
So you end up with a circular dependency that the market keeps trying to hand-wave away. Manufacturing weakness starts as inventory management, then becomes a cash flow story, then becomes a capex story.
The Fed can ease. It can’t force consumption.
The Circular Capital Problem
OpenAI took an ownership stake in Thrive Holdings in 2025. Thrive Capital had previously invested in OpenAI. OpenAI now owns part of the firm that owns part of OpenAI.
It’s disclosed. It’s legal. It’s also the kind of structure that should make you pause and ask a simple question.

Is new capital entering the system, or is existing capital moving in circles?
I’m not saying this is fraud. I’m not even saying it’s irrational. Sometimes these are strategic relationships. Sometimes they’re governance alignment. Sometimes they’re long-term partnership structures that make sense.
But the pattern matters because it changes what breaks when conditions tighten.
In a clean environment, interlocking ownership feels like “ecosystem building.” In a stressed environment, it can turn into dependency. If Fund A needs Company B’s valuation to stay high to justify Fund A’s marks, and Company B needs Fund A’s continued support to raise, you don’t have independent pillars. You have a ring.
Meanwhile, the hyperscalers are doing real spending.
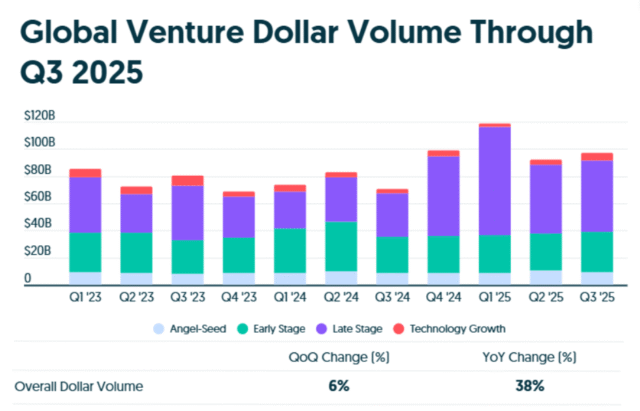
Amazon announced $50 billion in AI infrastructure investment for AWS beginning in 2026. Meta increased capex from $39 billion in 2024 to $60 to $65 billion in 2025. That’s actual build. Physical facilities. Servers. Long procurement chains. Real electricity consumption.
The difference is not “public good, private bad.” The difference is funding source and resilience.
Public market incumbents fund AI from operating cash flow. Private AI companies often fund it from continued capital inflows. If the inflow slows, burn rates stop being a footnote and start being the whole story.
That’s where this heads if the manufacturing speed bump turns into broader softness. The circular patterns are fine until they aren’t.
The Strategy Inc Math Problem
Strategy Inc (formerly MicroStrategy) has built a capital structure that introduces a very specific kind of fragility.
The company issued multiple classes of preferred stock. STRK at 8% dividend. STRF at 10% cumulative. STRD at 10% non-cumulative. STRC at variable rates currently 10.75%.
The dividend payments on these securities, combined with existing debt, exceed the company’s operating cash flow. The company depends on Bitcoin appreciation to service obligations.
And the preferred stock documentation is explicit about something that retail investors routinely miss. “The Company’s preferred securities are not collateralized by the Company’s bitcoin holdings and only have a preferred claim on the residual assets of the company.”
So no, this isn’t a Ponzi scheme. That term implies fraud. This is disclosed. Investors have the documents. It’s aggressive financial engineering, and it can create a self-reinforcing dynamic.
When Strategy’s stock price rises, it can issue shares to raise dollars to pay dividends. When the stock price falls, each issuance raises fewer dollars. That pushes the company toward issuing more shares to raise the same amount. More dilution pressures the stock price. The next round gets harder.
That’s the spiral. It’s mathematical, not moral.
Strategy held 649,870 BTC as of November 17, 2025. At current Bitcoin prices, that’s a large asset base. But the preferred holders don’t have a direct claim on those holdings. They have a claim on residual assets after debt.
If Bitcoin prices fall hard at the same time Strategy’s equity price falls, the spiral accelerates.
Now connect it back to AI, because the link isn’t rhetorical.
Bitcoin mining consumes a lot of electricity. Data centers consume a lot of electricity. They compete for the same constrained grid capacity.
If Bitcoin prices collapse and mining economics break, some of that capacity becomes available. That’s not a forecast. It’s a dependency worth keeping in mind.
More directly, if Strategy’s structure ever unwinds in a violent way, it could coincide with maximum pessimism in Bitcoin itself. Levered proxies have a habit of blowing up near the point where sentiment is worst. Sometimes that’s when you get generational entry points.
I’m not recommending anyone buy Bitcoin at some hypothetical bottom. I’m pointing at the mechanism. Tail risk exists. Tail risk can create moments when quality assets get dumped alongside the structure that was built on top of them.
The Robotics Supply Chain Opportunity
Foxconn announced intentions to deploy humanoid robots in its Houston AI plant. Market potential estimates reach $5 trillion according to industry sources. NVIDIA, Tesla, and other major technology firms have invested substantially in humanoid development.
When I look at this, I keep coming back to the same conclusion.
The obvious trade is the humanoid company. The cleaner opportunity is the supply chain.
Humanoids require components that don’t care which brand wins. Chips for inference. Sensors for vision. Batteries. Actuators. Software stacks that translate model output into motion control.
IDTechEx research says GPU deployments are “set to increase exponentially” in 2025, with AMD’s MI350 series beginning volume production in June 2025. NVIDIA still leads but competition is tightening. And the shortage conditions of 2023 to 2024 have moderated as supply increases.
I don’t know the exact timeline for humanoids, and I don’t pretend to. The technical hurdles are real. Sensor reliability, actuator precision, battery endurance, and the gap between a controlled demo and messy reality.
But the supply chain spends money long before mass deployment. Research budgets still buy components. Pilot programs still order systems. The companies selling picks and shovels to multiple humanoid programs get paid even if the “winner” doesn’t arrive on schedule.
That’s the kind of exposure I like in a world where timelines are always optimistic.
The GLP-1 Second-Order Effects
GLP-1 receptor agonists like semaglutide, including Ozempic and Wegovy, are changing consumer behavior in ways that show up in spending patterns.
PwC’s 2024 survey of 3,000 individuals found GLP-1 users cut food purchases by 11%, particularly high-calorie snacks and alcohol. One-third of heavy drinkers reduced alcohol intake.
Spending on GLP-1s rose from $13.7 billion in 2018 to $71.7 billion in 2023, a 500% increase. Semaglutide became the best-selling drug in the United States with $13.8 billion in sales in 2023. Over 8% of Americans currently take GLP-1s, with 35% expressing interest.
Yale School of Medicine research published in September found GLP-1 receptor agonists “reduced an enzyme that metabolizes alcohol” and “led to higher blood alcohol levels.” Users consume less alcohol but metabolize it differently. That’s an unexpected interaction you wouldn’t guess from the macro narrative.
Where does AI come in?
First, shifting consumption reshapes retail and consumer discretionary dynamics. When people buy less food and alcohol, that spend goes somewhere else. Clothing, supplements, travel, whatever the substitution ends up being. AI-driven analytics and recommendation systems don’t get to live in a stable world. They have to adapt to changing data patterns.
Second, drug development is increasingly tied to AI tooling, whether it’s discovery, trial design, or patient stratification. GLP-1s are a reminder that the biggest economic changes often come from biology, not software, and AI will sit inside that engine too.
The larger point is that the AI story isn’t confined to “tech.” Real-world behavior changes create new datasets. New datasets change what models learn. Models then feed back into what companies build and sell. It’s a loop.
What the Market Is Missing
A lot of the sell-side tone heading into 2026 is “calm and clarity after 2025 volatility.”
Morgan Stanley forecasts that “the investment landscape is shifting toward a more favorable environment—particularly for risk assets.” They predict the S&P 500 reaching 7,800, a 14% gain, with fiscal policy, monetary policy, and deregulation “all working together in a way that rarely happens outside of a recession.”
In the same breath, they also say “the front part of the year is going to be much weaker,” with growth around 1.75% in 2026. J.P. Morgan shares the bullish equity view, predicting “a third consecutive year of double-digit gains” driven by “13% S&P 500 earnings growth in 2026” and “~22% Mag 7 earnings growth.” Their rates view is more cautious, expecting “range-bound” rates as the Fed balances inflation and growth.
ABN AMRO expects continued dollar weakness ahead, not stability, with depreciation continuing as global capital flows adjust to monetary policy dynamics.
So the market is pricing something like calm. The forecasts, even the bullish ones, quietly admit front-loaded weakness.
That setup creates a very specific kind of imbalance.
If the manufacturing speed bump is truly just inventory normalization and it clears by Q2 2026, risk assets can do what the sell-side wants them to do. If the overhang lasts and starts bleeding into profits, then you get more rate cuts alongside rising recession probability. That is not a contradiction. That’s how cycles work.
The AI infrastructure buildout benefits in either world, but in different ways.
A short manufacturing slowdown can free capacity and improve procurement terms. A deeper slowdown can make capital cheaper, but also makes revenue visibility worse and slows enterprise adoption.
The place I keep coming back to is the gap between quality public incumbents and parts of the private AI ecosystem.
Meta traded at 27.94 times earnings with a stock price of $647 as of late November 2025. Google shows similar valuation metrics. These companies generate cash. They fund AI from operations. Their valuation is anchored in earnings, not a financing window staying open forever.
On the other side, you have levered structures like Strategy Inc and private AI companies where ownership and funding start to look circular. Those are the places that break first when capital gets careful.
So the framework I’m using is simple. Own quality. Avoid leverage. Watch the manufacturing data and Fed language. Pay attention to where capital is recycling instead of entering fresh.
The Speed Bump Resolution Framework
I don’t think the manufacturing speed bump is permanent. I do think it’s measurable. So I’m tracking five signals that tell me whether it’s clearing or getting worse.
ISM New Orders above 50 for two consecutive months would signal demand recovery. November was 47.4. One month above 50 could be noise. Two months tells me something changed.
Both PMIs above 50 at the same time would tell me the inventory trap is clearing. November had ISM at 48.2 and S&P Global at 52.2. Demand and production were out of sync. I want to see them align.
The PMI gap below 2 points would be the clean convergence signal. A 4-point spread is not “normal.” It’s the system telling you goods are being made faster than they’re being sold.
Inventory-to-sales below 1.32 would show stockpiles normalizing. August at 1.37 is extreme. A move back toward 1.32 or lower tells me digestion is happening.
ISM Employment above 48 would show hiring resuming. November was 44.0, which is not a soft landing print. When employment climbs back toward expansion territory, it’s a sign manufacturers are no longer just cutting to survive the inventory hangover.
No single metric answers it. But when several line up, the picture gets clear without needing a heroic forecast.
If ISM New Orders moves above 50 and holds, the gap narrows, and inventories start falling, then the speed bump likely resolves in early 2026.
If New Orders stays below 48 into January and the gap stays wide, then this runs longer. That’s when the Fed eases faster and AI timelines start slipping for reasons the market won’t blame on AI.
Critical Dates Ahead
The next month gives early tells.
December 9-10 is the Fed meeting. Market pricing implies about an 80% chance of a 25 basis point cut. The decision matters less than Powell’s tone. If he leans into labor and manufacturing softness, easing accelerates. If he leans into inflation persistence, the pace slows.
December 17 brings inventory data for September 2025. August’s 1.37 reading was the red flag. If September rises again, the trap deepens. If it rolls over, normalization may already be starting.
December 19 brings S&P Global Flash PMI for December. That’s your first look at whether output is finally reacting to demand reality.
January 5 brings ISM PMI for December. That’s the big one. December captures holiday demand and year-end spending behavior. If ISM New Orders prints above 50, you have real recovery. If it falls below 47, the speed bump is turning into something louder.
These are the dates where the story stops being narrative and becomes data.ess is temporary inventory normalization or the beginning of broader economic contraction.
The Bottom Line
Companies pulled demand forward ahead of tariffs. That move showed up as a manufacturing mirage. Output looked strong because ordering was strong.
Now the hangover is here. Warehouses are full. New orders are weak. Employment is soft. That’s what a digestion phase looks like.
The PMI divergence is the cleanest window into the mechanics. ISM says demand is shrinking. S&P Global says production is still expanding. The gap is inventory piling up. It will close.
The Fed is easing, but it can’t force anyone to buy what’s already sitting on shelves. Cheaper money helps financing. It doesn’t fix a demand void.
AI keeps building, but it builds inside the real economy. It needs equipment, crews, power, and buyers with budgets. Circular funding structures and levered proxies don’t age well when the macro gets shaky. Cash-generating incumbents tend to.
I’m watching for the inventory drawdown, the PMI convergence, and the tone shift from the Fed. That’s the window where leverage unwinds and quality gets mispriced.
And that’s usually where the best entries appear.